Realtime audio spectrogram analyzer
[Fall 2023] This project aims to design and implement an interactive audio spectrogram analyzer that leverages the capabilities of Fast Fourier Transform (FFT) algorithms to analyze the spectrogram of real-time audio pieces and visually present on a gray-scaled VGA display. We also implemented a Python script to generate audio according to the given picture input. The generated audio contains many single-tone audios, with frequency and volume determined by the color depth of the image pixels. Wi
- Suitable forB.Tech/B.E Embedded Systems students
- Build time4-6 weeks
- LevelBeginner
- Available atAjvika Labs, Kakinada
About this project
Table of Contents
Introduction
High-Level Design
2.1
Workflow Overview
2.2
ADC and DMA
2.3
FFT
2.4
VGA Drawer
2.5
User Interface
2.6
Python Script for Audio Generator
2.7
Hardware/Software Tradeoffs
2.8
Discussion of Patents, Copyrights, and Trademarks
Hardware Design
3.1
VGA Display
3.2
High Pass Filter
3.3
Resources Used
Software Design
4.1
Overview
4.2
FFT Function
4.3
VGA Display
4.4
User Interface
4.5
Things We Tried That Didn't Work
Results of the Design
5.1
Accuracy and Speed of Execution
5.2
Safety
5.3
Usability
Conclusions
6.1
Conformance with Applicable Standards
6.2
Intellectual Property Considerations
Appendix A
Additional Appendices
1 Introduction
This project aims to design and implement an interactive audio spectrogram analyzer that leverages the capabilities of Fast Fourier Transform (FFT) algorithms to analyze the spectrogram of real-time audio pieces and visually present on a gray-scaled VGA display. We also implemented a Python script to generate audio according to the given picture input. The generated audio contains many single-tone audios, with frequency and volume determined by the color depth of the image pixels. With these two designs, we are able to draw interesting pictures in our audio spectrogram analyzer, which is great fun to explore.
If the embedded linke doesn't work, you can also find our demo here:
https://youtu.be/C8ed5-WB-MY?feature=shared
2 High-Level Design
In lab 1, we used the Merlin Bird ID App to successfully recognize our synthesized bird calls while displaying spectrograms, which was very interesting. So we want to design an audio Spectrogram Analyzer using a Raspberry Pi, and use Python scripts to create sound snippets whose spectrograms are fun to image. This project embarks on an innovative journey to develop an interactive music spectrum analyzer, utilizing the robust capabilities of FFT algorithms. Our primary objective is to intricately analyze musical compositions and dynamically showcase their spectral properties on a VGA display.
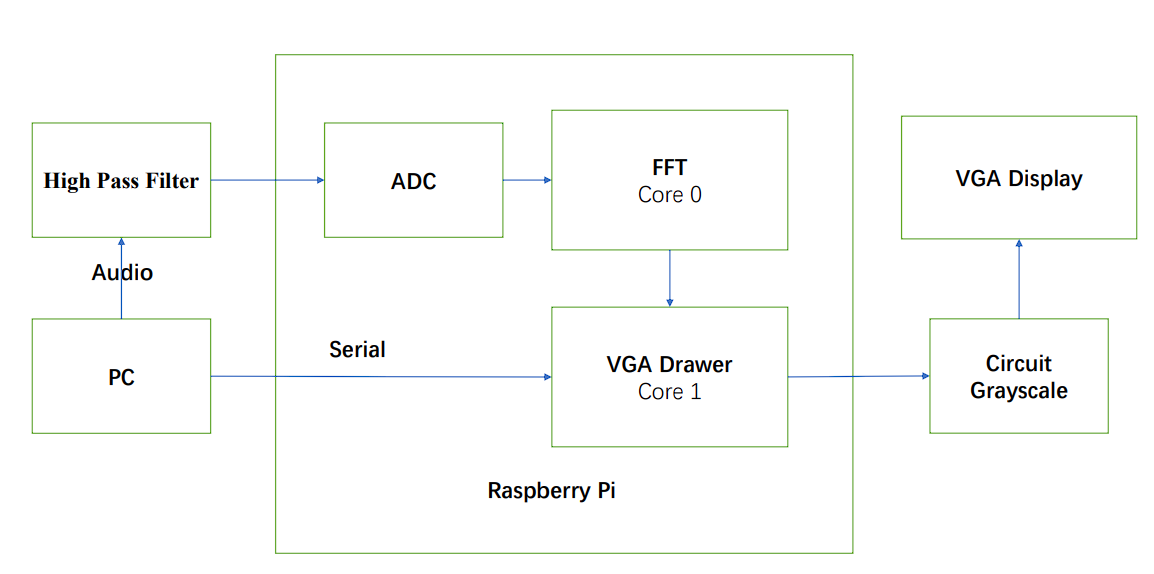
Figure 1. Simple Components Diagram
2.1 Workflow Overview
First we deal with the analog audio signal, which comes from the computer's 3.5 mm headphone jack (we use the PC to play sound). This signal is processed by a high-pass filter to eliminate the negative component of the sinusoidal waveform. This is because the Pico can only receive positive audio inputs, and the PC headphone jack plays audio from a voltage range of (-2 to 2 volts). These filtered signals are then split into sampling windows for subsequent processing. Our program performs a key process on this data: converting the audio data from the time domain to the frequency domain using the Fourier Transform algorithm. Next, the FFT data is presented as a power spectrum in a grayscale plot on a VGA display. There is also a user interface to control the mode of VGA drawing.
2.2 ADC and DMA
The analog-to-digital converter (ADC) of the Raspberry Pi microcontroller converts the continuous audio signal into a discrete signal. The sampled data is then transmitted by DMA through a FIFO to the CPU for further analysis. The configuration of the ADC and DMA is taken from the Hunter's Audio FFT demo code. The final audio to be transferred to the FFT function is sampled at a frequency of 10kHz with a sample buffer size of 256. This design reduces the amount of data to be processed while maintaining the maximum resolution in 10kHz/2=5kHz. The tradeoff is a lower frequency resolution.
2.3 FFT
Fast Fourier Transform(FFT) is one of the most important algorithms ever developed. It is the basic algorithm in most digital communication, audio, and image compression. Compared with Discrete Fourier Transform (DFT) in complexity
O
(
n
)
, FFT greatly reduces to
O
(
n
l
o
g
n
)
. We work with the FFT implementation in the Audio FFT demo code provided by Hunter Adams. We made some parameter adjustments. Between the display resolution and the processing throughput, we traded off the ability to do the computation faster but still maintain a good resolution.
In software design, we mainly have two important functions, one is the FFT transformation that reads audio samples from ADC and DMA buffer, and then performs the FFT transformation of them. The other function is the VGA drawer, which calculates the log magnitude of frequency amplitude from FFT results, and draws them on the VGA display. These two functions are run on two cores of Raspberry Pi, which can speed up the program execution performance. To achieve that, a semaphore is used. When the FFT calculation is finished, the semaphore is activated so the VGA drawer can start drawing the spectrogram. In the end, we chose a 256-point FFT with a resolution of about 80 Hz.
2.4 VGA Drawer
The human perception of sound is logarithmic in nature. By taking the logarithm of the spectrogram values, we compress the dynamic range, making it easier to visualize and interpret features across a wide range of intensity levels. This step involves a quick logarithmic function, designed to minimize processing time without compromising on accuracy. This efficient conversion is key to maintaining the real-time interactivity of our analyzer. Finally, the Power Spectrum is rendered onto a VGA screen, and displayed as a spectrum analyzer figure. This visualization is presented in a nuanced 3-bit grayscale map, offering a detailed yet accessible view of the audio’s spectral characteristics.
2.5 User Interface
Our user interface uses Putty which runs on a PC. This primarily aims to allow control of the VGA drawing patterns. We provide these modes. The first is the normal plotting mode “Default”, where the VGA display will continuously plot the spectrum from left to right. Then there is a pause mode “Stop Display”, in which the VGA monitor stops plotting, and after the exit of the pause mode, a new spectrogram is plotted at the pause position. Another important mode “Stop When Fill the Screen” enters the pause mode after the VGA monitor has plotted an entire screen of spectrograms, which is very useful for our image demo.
The Spectrum Analyzer's user interface offers five distinct options:
“Default”: Resets all variables and flags, and redraws the spectrum on the VGA display.
“Clean Screen”: Halts current operations and clears the entire VGA display.
“Stop Display”: Freezes the display, stopping the drawing of new spectrum graphs.
“Stop When Fill the Screen”: Freezes the display once the cursor reaches the right edge of the screen.
“Change the Draw Speed”: Adjusts the drawing or updates the speed of the spectrum on the VGA display.
2.6 Python Script for Audio Generator
Inspired by lab1, the spectrogram can present some interesting images. Using Python script code, we generate the corresponding audio based on the input image, whose spectrogram is a low-resolution version of that image.
Figure 2. Original Image (left), Spectrogram of Generated Audio (right)
2.7 Hardware/Software Tradeoffs
There are not many hardware/software tradeoffs involved in our project. However, it is very important to consider code optimization in software. The FFT algorithm is computationally intensive, so as we wanted to achieve real-time display, we reduced the sample size and sacrificed the display resolution to significantly speed up the computation. In addition, we use approximations to do the computation faster, such as using fixed-point arithmetic instead of floating-point arithmetic, and using the Alpha max plus beta min algorithm to approximate the magnitude of the complex numbers. Also, consider that calculating the Log is very complicated, but in the actual display, the accuracy is not very important, because we only need to know in which range its log is. Therefore we use the fast logarithm calculation algorithm to approximate the calculation. Finally, we also utilize an overclocking technique in order to meet the time constraints of the FFT computation.
2.8 Discussion of Patents, Copyrights, and Trademarks
The hardware configuration of ADC, DMA, and software FFT algorithm implementation comes from the open-source demo code implemented by Hunter. The specific FFT algorithm is the Cooley-Tukey FFT algorithm. Fast Logarithmic Calculation Algorithm from Open Source Algorithms website, Bit Twiddling Hacks By Sean Eron Anderson.
3 Hardware Design
The Pi Pico is a dual-core ARM Cortex M0+ processor designed with a PR2040 chip. It runs at 25 Mhz clock frequency. The following peripherals of the port are used in the project.
3.1 VGA Display
We use a 3-bit color 640 * 480 VGA display. Since the VGA driver is already written, in order to display a grayscale spectrogram, we can just change the values given by the microcontroller to the GRB channels. This setup requires the RGB to receive voltages simultaneously ranging from 0V to ⅞
*
0.7V in increments of ⅛
*
0.7V, transitioning from black to white. The circuit diagram (Figure 3) shows that three resistors are used in parallel, with a total resistance of 330 ohms. Besides GPIO 18/19/20, GPIO 16 is connected to VGA HSync. GPIO 17 is connected to VGA VSync. VGA pin-outs are shown in Figure 4.
Figure 3. Circuit diagram for a grayscale spectrogram
Figure 4. VGA Pin-Outs
3.2 High Pass Filter
The audio output voltage ranges from -2V to 2V, which needs to be biased and scaled to 0-3.3V for ADC sampling. This can be achieved using the below-shown high-pass filter for biasing. GPIO 26 is connected to audio input.
Figure 5. High Pass Filter
3.3 Resources Used
PIO state machines 0, 1, and 2 on PIO instance 0
DMA channels 0, 1, 2, and 3
ADC channel 0
153.6 kbytes of RAM (for pixel color data)
4 Software Design
4.1 Overview
The software part of this project is developed based on the Audio FFT to VGA Display demo code provided by Prof. Hunter Adams. This is a protothread that uses an ADC to collect audio signal data and an FFT function to convert the audio signal fro
Technologies used
Hardware components
- VGA display
- IMU
- ADC
Software & tools
- Python
Project demo video
What you get
- Working project / hardware kit, tested before delivery
- Complete source code with explanation
- Project demo and guidance for your viva
- Project report, PPT and IEEE paper support (on request)
Related Embedded Systems projects

Gas Leakage Detector Using Arduino
A budget-friendly LPG gas leak detector built with an Arduino and MQ-5 gas sensor, triggering a buzzer and LED when unsafe gas levels are de...
View project
Simple Alarm System
A beginner-friendly home alarm with PIR motion sensing, keypad PIN entry, and separate entry/exit timing delays, built to be easy to expand.
View project
Ultrasonic Sensor Project with Arduino UNO Q
A beginner-friendly first Arduino UNO Q project: a servo-swept ultrasonic sensor that renders a live sweeping radar display in a web browser...
View project
3D Audio Localization
[Fall 2025] We designed a real-time embedded system that localizes sound sources in three dimensions and visualizes them live using a four-m...
View project