Keyboard Hero
[Spring 2025] Keyboard Hero is a rhythm game where players match on-screen notes to a five-button “keyboard” in time with a user-selected piano song.
- Suitable forB.Tech/B.E Embedded Systems students
- Build time4-6 weeks
- LevelBeginner
- Available atAjvika Labs, Kakinada
About this project
KEYBOARD
HERO
A Raspberry Pi Pico Based
Rhythm Game
Project Introduction
Overview
Keyboard Hero is a rhythm game where players match on-screen notes to a five-button “keyboard” in time with a user-selected piano song.
Inspired by the popular rhythm game “Guitar Hero,” we chose to make our own rendition of it using a VGA Display and 5-button user interface resembling a keyboard. To add a layer of complexity and intrigue to the project,
the song notes are not pre-programmed into the game (similar to how most rhythm games are designed) but rather they’re determined based on audio input coming from an external computer via an audio jack. We then use the
RP2040 to process the audio and map the incoming audio note to the proper note color on the screen based on its fundamental frequency. To make this matter simpler, we restrict this project to playing only piano songs which
use only one instrument therefore limiting audio frequency content. The audio input is also played back from a speaker in synchronization with the keyboard hits. This allows for a seamless user experience where the note colors
that roll onto the screen clearly align with the note played by the song, and the music played by the speaker is in tune with the keyboard notes played by the user in real time.
Here is a Youtube video of us demoing the game!:
Rhythm Game Implemented On Raspberry Pi Pico
Design Inspiration and Rationale
Guitar Hero™ is a popular rhythm game first released in the 2000s where players use a guitar-shaped game controller to simulate guitar-playing for popular songs. The controller has
five color keys (green, red, yellow, blue, and orange) on the guitar’s neck and a strum bar on the body. The idea is for the user to press down on a particular color key and hit the strum bar at the
same time that a particular color key rolls down to the bottom of the screen. Music also plays in the background in tune with the notes being “played” by the guitar. Our hope for this project was to
recreate a bare-bones version of this game using the tools and concepts that we learned in ECE 4760.
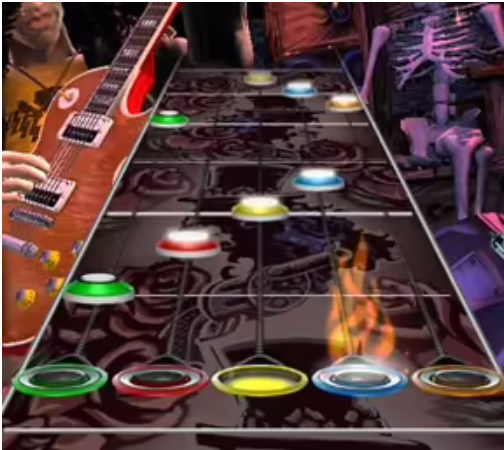
We chose to use a VGA graphics display to recreate a basic version of the on-screen visual with 5 note receptors on the bottom of the screen and notes rolling down from the top of the screen in sequence with the music.
Figure 1: Guitar Hero Notes Example
Figure 2: VGA Display with not receptors and one note rolling down
To make things simpler, instead of using a guitar as our controller, we built a “keyboard” consisting of a small wooden pallet with 5 colored buttons - each corresponding to the five note receptors on the screen.
Figure 3: Guitar Hero Game controller for the Wii Console
Figure 4: Keyboard with 5 colored buttons
Audio was fed into the system via the audio jack of a computer playing a piano song, to then process the audio and play it back in synchronization with the game.
Figure 5: Computer transmitting audio from video via audio jack
High Level Design
Background Math
Nyquist Frequency and sampling frequency for audio signals
In order to accurately sample the incoming audio signal we have to choose an apt sampling frequency. For reference, an audio signal has a frequency range between 20 Hz and 20 kHz. The Nyquist Frequency is the highest frequency that can be accurately captured for a sampled signal given a certain sampling frequency. It is considered to be equal to half of the sampling rate. Based on this we can say that if we were to consider 20 kHz to be our Nyquist frequency (since it’s the upper limit of the audio frequency range), then our sampling frequency should be 40 kHz since:
Sampling frequency = 2*(Nyquist Frequency)
The issue with a sampling frequency of 40 kHz is that it forces our system’s interrupt service routine (which handles sampling logic) to have an especially short run time which effectively limits its capabilities. Since the bulk of the audio content (particularly for piano songs) does not reside at higher frequencies, we can lower the sampling rate significantly in order to increase interrupt service routine and still maintain good quality audio sampling fidelity.
In this case, we opted for 10kHz as our Nyquist Frequency and hence our sampling frequency was 20 kHz.
Note Frequency Detection
To determine which of the five colored-notes to play on the screen, the frequency of the note being received by the system in real-time has to be measured with relative accuracy. This game is programmed for songs using notes based around middle C on Octave 4.
The frequency input is mapped to a particular color based on the frequency range “bin” it lands in. The frequency to note color mapping is explained in the table below:
In order to measure the fundamental frequency of a note being played we make use of a few features that our system affords. Because we are sampling the audio signal at a precise rate (10 ksps), and we know the exact number of audio samples that are stored in a buffer every time we detect a new note being played (2000 in this case), we effectively know the exact length of the sampling period for each note.
Sampling time period
= (sample buffer size) / (sampling rate)
= (2,000 samples) / (10,000 samples per second)
= 0.2 seconds
We then measure the number of “crossovers” that occur during the sampling period. Assuming we were to have a signal that monotonically increases and monotonically decreases each cycle, we can count the number of times that the signal samples jump from below the mean value of the signal to above the mean value. Understanding that every two crossovers correspond to a single signal cycle, we can measure the frequency of the signal as follows:
Frequency = [ (# of crossovers) / 2 ] / (Sampling time period)
It’s important to note that the fact that the system only requires each detected frequency be “binned” to a certain frequency range in order to coordinate a note frequency to a note color means that the system allows for a certain margin of error for the frequency measurement in the order of +/- 10s of Hz. This makes it so that the frequency measurement, although it needs to be relatively accurate, does not have to be perfect and can account for some degree of miscalculation.
Low Pass Filtering
As mentioned above, this frequency measurement technique assumes that the signal be monotonically increasing or monotonically decreasing each half-cycle to ensure an accurate measurement of the number of crossovers. When a piano note plays (although it is easy to detect its fundamental frequency upon inspection), it contains noticeable higher order harmonics
that make it susceptible to a higher number of crossovers than what is needed to accurately measure the notes fundamental frequency. To mitigate this, this system uses a software-implemented digital low-pass filter which low-passes the audio adc input being fed into the system and outputs a signal that, although not exactly a pure tone, does monotonically increase and decrease with considerable consistency. This ensures a relatively accurate measurement of the number of crossovers.
The digital low pass filter is implemented by running each audio input sample through the following line of code:
filter_lp_output = filter_lp_output + ((filter_lp_input - filter_lp_output) >> 3);
filter_lp_input is the input sample and filter_lp_output is the output sample. As shown, the filter makes use of the previous output sample to process the upcoming input sample.
The number of bits by which the difference between the input and output sample is shifted is of similar functionality as the RC time constant in an RC low-pass filter circuit. The greater the number of bits, the lower the effective “cutoff frequency” of this filter is. Using an especially high number of bits can degrade the signal however. Three bits seemed like a good number given how the signal inputs are twelve bits in total. Three bits is enough to get rid of the higher order harmonics without degrading the signal too much.
A more in-depth technical discussion is given in this page:
Digital Lowpass Filters – Van Hunter Adams
Logical Structure
Figure 6: Hardware System Flowchart
The system is structured into five components:
Computer with audio input:
A computer is used to supply audio input into the Audio Processing Raspberry Pi Pico via an audio jack that feeds a signal into the ADC. For the purposes of this project, the audio being fed in is a piano song.
Audio Processing Raspberry Pi Pico Microcontroller:
We use one RP Pico to take care of audio processing. This pico sends the audio input it receives from the computer into a speaker with slight time delay to allow for synchronization with the VGA graphics. It also takes care of detecting whenever a new note is played and the frequency of said note. Depending on the frequency, it sends a number between 0 and 4 to the VGA Graphics RP Pico via UART.
Each number corresponds to one of the five frequency “bins.” This bin number then gets mapped to one of the five notes that show up on the VGA display. Each time a new note is detected, a new note should show up on the VGA screen with the correct frequency to note color mapping.
VGA Graphics Raspberry Pi Pico Microcontroller:
We use another RP Pico to handle the VGA Graphics processing. This includes generating the five note receptors, scroll-down notes, a score bar, and prompted instructions. As mentioned above, the scroll-down notes are generated based on the timing and contents of UART input.
VGA Display:
The Video Graphics Array (VGA) Display is the physical machine used to display the game. It has 480 x 640 resolution and hooks up to the pico using a VGA connector.
Speaker:
We use a speaker to play the input music in tune with the VGA Display.
Keyboard:
The keyboard contains five colored buttons corresponding to each of the note receptors on
HERO
A Raspberry Pi Pico Based
Rhythm Game
Project Introduction
Overview
Keyboard Hero is a rhythm game where players match on-screen notes to a five-button “keyboard” in time with a user-selected piano song.
Inspired by the popular rhythm game “Guitar Hero,” we chose to make our own rendition of it using a VGA Display and 5-button user interface resembling a keyboard. To add a layer of complexity and intrigue to the project,
the song notes are not pre-programmed into the game (similar to how most rhythm games are designed) but rather they’re determined based on audio input coming from an external computer via an audio jack. We then use the
RP2040 to process the audio and map the incoming audio note to the proper note color on the screen based on its fundamental frequency. To make this matter simpler, we restrict this project to playing only piano songs which
use only one instrument therefore limiting audio frequency content. The audio input is also played back from a speaker in synchronization with the keyboard hits. This allows for a seamless user experience where the note colors
that roll onto the screen clearly align with the note played by the song, and the music played by the speaker is in tune with the keyboard notes played by the user in real time.
Here is a Youtube video of us demoing the game!:
Rhythm Game Implemented On Raspberry Pi Pico
Design Inspiration and Rationale
Guitar Hero™ is a popular rhythm game first released in the 2000s where players use a guitar-shaped game controller to simulate guitar-playing for popular songs. The controller has
five color keys (green, red, yellow, blue, and orange) on the guitar’s neck and a strum bar on the body. The idea is for the user to press down on a particular color key and hit the strum bar at the
same time that a particular color key rolls down to the bottom of the screen. Music also plays in the background in tune with the notes being “played” by the guitar. Our hope for this project was to
recreate a bare-bones version of this game using the tools and concepts that we learned in ECE 4760.
We chose to use a VGA graphics display to recreate a basic version of the on-screen visual with 5 note receptors on the bottom of the screen and notes rolling down from the top of the screen in sequence with the music.
Figure 1: Guitar Hero Notes Example
Figure 2: VGA Display with not receptors and one note rolling down
To make things simpler, instead of using a guitar as our controller, we built a “keyboard” consisting of a small wooden pallet with 5 colored buttons - each corresponding to the five note receptors on the screen.
Figure 3: Guitar Hero Game controller for the Wii Console
Figure 4: Keyboard with 5 colored buttons
Audio was fed into the system via the audio jack of a computer playing a piano song, to then process the audio and play it back in synchronization with the game.
Figure 5: Computer transmitting audio from video via audio jack
High Level Design
Background Math
Nyquist Frequency and sampling frequency for audio signals
In order to accurately sample the incoming audio signal we have to choose an apt sampling frequency. For reference, an audio signal has a frequency range between 20 Hz and 20 kHz. The Nyquist Frequency is the highest frequency that can be accurately captured for a sampled signal given a certain sampling frequency. It is considered to be equal to half of the sampling rate. Based on this we can say that if we were to consider 20 kHz to be our Nyquist frequency (since it’s the upper limit of the audio frequency range), then our sampling frequency should be 40 kHz since:
Sampling frequency = 2*(Nyquist Frequency)
The issue with a sampling frequency of 40 kHz is that it forces our system’s interrupt service routine (which handles sampling logic) to have an especially short run time which effectively limits its capabilities. Since the bulk of the audio content (particularly for piano songs) does not reside at higher frequencies, we can lower the sampling rate significantly in order to increase interrupt service routine and still maintain good quality audio sampling fidelity.
In this case, we opted for 10kHz as our Nyquist Frequency and hence our sampling frequency was 20 kHz.
Note Frequency Detection
To determine which of the five colored-notes to play on the screen, the frequency of the note being received by the system in real-time has to be measured with relative accuracy. This game is programmed for songs using notes based around middle C on Octave 4.
The frequency input is mapped to a particular color based on the frequency range “bin” it lands in. The frequency to note color mapping is explained in the table below:
In order to measure the fundamental frequency of a note being played we make use of a few features that our system affords. Because we are sampling the audio signal at a precise rate (10 ksps), and we know the exact number of audio samples that are stored in a buffer every time we detect a new note being played (2000 in this case), we effectively know the exact length of the sampling period for each note.
Sampling time period
= (sample buffer size) / (sampling rate)
= (2,000 samples) / (10,000 samples per second)
= 0.2 seconds
We then measure the number of “crossovers” that occur during the sampling period. Assuming we were to have a signal that monotonically increases and monotonically decreases each cycle, we can count the number of times that the signal samples jump from below the mean value of the signal to above the mean value. Understanding that every two crossovers correspond to a single signal cycle, we can measure the frequency of the signal as follows:
Frequency = [ (# of crossovers) / 2 ] / (Sampling time period)
It’s important to note that the fact that the system only requires each detected frequency be “binned” to a certain frequency range in order to coordinate a note frequency to a note color means that the system allows for a certain margin of error for the frequency measurement in the order of +/- 10s of Hz. This makes it so that the frequency measurement, although it needs to be relatively accurate, does not have to be perfect and can account for some degree of miscalculation.
Low Pass Filtering
As mentioned above, this frequency measurement technique assumes that the signal be monotonically increasing or monotonically decreasing each half-cycle to ensure an accurate measurement of the number of crossovers. When a piano note plays (although it is easy to detect its fundamental frequency upon inspection), it contains noticeable higher order harmonics
that make it susceptible to a higher number of crossovers than what is needed to accurately measure the notes fundamental frequency. To mitigate this, this system uses a software-implemented digital low-pass filter which low-passes the audio adc input being fed into the system and outputs a signal that, although not exactly a pure tone, does monotonically increase and decrease with considerable consistency. This ensures a relatively accurate measurement of the number of crossovers.
The digital low pass filter is implemented by running each audio input sample through the following line of code:
filter_lp_output = filter_lp_output + ((filter_lp_input - filter_lp_output) >> 3);
filter_lp_input is the input sample and filter_lp_output is the output sample. As shown, the filter makes use of the previous output sample to process the upcoming input sample.
The number of bits by which the difference between the input and output sample is shifted is of similar functionality as the RC time constant in an RC low-pass filter circuit. The greater the number of bits, the lower the effective “cutoff frequency” of this filter is. Using an especially high number of bits can degrade the signal however. Three bits seemed like a good number given how the signal inputs are twelve bits in total. Three bits is enough to get rid of the higher order harmonics without degrading the signal too much.
A more in-depth technical discussion is given in this page:
Digital Lowpass Filters – Van Hunter Adams
Logical Structure
Figure 6: Hardware System Flowchart
The system is structured into five components:
Computer with audio input:
A computer is used to supply audio input into the Audio Processing Raspberry Pi Pico via an audio jack that feeds a signal into the ADC. For the purposes of this project, the audio being fed in is a piano song.
Audio Processing Raspberry Pi Pico Microcontroller:
We use one RP Pico to take care of audio processing. This pico sends the audio input it receives from the computer into a speaker with slight time delay to allow for synchronization with the VGA graphics. It also takes care of detecting whenever a new note is played and the frequency of said note. Depending on the frequency, it sends a number between 0 and 4 to the VGA Graphics RP Pico via UART.
Each number corresponds to one of the five frequency “bins.” This bin number then gets mapped to one of the five notes that show up on the VGA display. Each time a new note is detected, a new note should show up on the VGA screen with the correct frequency to note color mapping.
VGA Graphics Raspberry Pi Pico Microcontroller:
We use another RP Pico to handle the VGA Graphics processing. This includes generating the five note receptors, scroll-down notes, a score bar, and prompted instructions. As mentioned above, the scroll-down notes are generated based on the timing and contents of UART input.
VGA Display:
The Video Graphics Array (VGA) Display is the physical machine used to display the game. It has 480 x 640 resolution and hooks up to the pico using a VGA connector.
Speaker:
We use a speaker to play the input music in tune with the VGA Display.
Keyboard:
The keyboard contains five colored buttons corresponding to each of the note receptors on
Technologies used
Hardware components
- RP2040
- Raspberry Pi Pico
- VGA display
- IMU
- speaker
- ADC
Software & tools
- C
- Arduino IDE
Project demo video
What you get
- Working project / hardware kit, tested before delivery
- Complete source code with explanation
- Project demo and guidance for your viva
- Project report, PPT and IEEE paper support (on request)
Delivery & Payment
Delivery takes a minimum of two weeks from the date your inquiry is confirmed.
Payment is in two parts:
• 50% advance to start the project
• Remaining 50% before delivery
Note:
• Documentation and PPT are not included by default
• If you need documentation/PPT, it can be arranged for extra time and cost
We'll confirm the exact timeline and cost with you after reviewing your requirements.
Related Embedded Systems projects

Embedded Systems
Gas Leakage Detector Using Arduino
A budget-friendly LPG gas leak detector built with an Arduino and MQ-5 gas sensor, triggering a buzzer and LED when unsafe gas levels are de...
View project
Embedded Systems
Simple Alarm System
A beginner-friendly home alarm with PIR motion sensing, keypad PIN entry, and separate entry/exit timing delays, built to be easy to expand.
View project
Embedded Systems
Ultrasonic Sensor Project with Arduino UNO Q
A beginner-friendly first Arduino UNO Q project: a servo-swept ultrasonic sensor that renders a live sweeping radar display in a web browser...
View project
Embedded Systems
3D Audio Localization
[Fall 2025] We designed a real-time embedded system that localizes sound sources in three dimensions and visualizes them live using a four-m...
View project