Christmas caroling muscle machine
[Fall 2023] We used surface electromyography, EMG, to measure muscle response through microvolt changes seen when flexing a muscle that fed into a Markov model trained on Christmas music that created instrument melodies influenced by the strength of muscle tension. We wanted to implement this project because of our interest in human-interaction with technology and sensors to create art, in this case music.
- Suitable forB.Tech/B.E Embedded Systems students
- Build time4-6 weeks
- LevelAdvanced
- Available atAjvika Labs, Kakinada
About this project
Project Introduction

We used surface electromyography, EMG, to measure muscle response through microvolt changes seen when flexing a muscle that fed into a Markov model trained on Christmas music that created instrument melodies influenced by the strength of muscle tension. We wanted to implement this project because of our interest in human-interaction with technology and sensors to create art, in this case music.
High-Level Design

Background

For our signal conditioning system from the electrode input, we used two sources primarily to look at example systems that worked previously in conditioning electrode input: Bruce Land's Physiological AC Preamplifier and a DIY muscle sensor/EMG circuit for an Arduino designed by Advancer Technologies. In Bruce's physiological amplifier, he utilized a passive lowpass filter with the incoming electrode input then passed it through an INA121 differential amplifier (to determine the voltage difference between the two working electrodes) then passed it through a highpass filter, and finally an LM358 opamp to amplify the signal. Then Bruce adjusted the highpass and lowpass filter based on the type of physiological sensor being used. In addition, Bruce split a 9V battery so there was a +/- 4.5V line in addition to the ground line. The DIY muscle sensor circuit utilized an INA106 to determine the difference between the two working electrodes, then passed the signal through three TL072 dual-op amps to amplify, smooth, and rectify the signal. This circuit was powered by two 9V batteries with a +/- 9V rail.
Overall Design

In the program, we use two Markov models to determine what note is played and the length of the note. These Markov models allow us to stochastically determine the next value based on the previously selected value. Each value, be it a note or a note length, has a set of transition probabilities for each subsequent value from it. In this project, we went through a list of Christmas songs and counted up the frequencies of note transitions and note length transitions, which we used to create our probability distributions for each note/note length. With this, we were able to bias our model to choose notes and note lengths that sound somewhat Christmasy, to fit the season.
Then, we integrated the voltage measurements from the arm's muscle responses to bias the probabilities based on the magnitude of the muscle voltage. Since the notes we chose are in order of increasing pitch, and the note lengths are in order of decreasing length, larger values of muscle voltage will create higher-pitched, fast-paced songs. In addition to this, we also increase the tempo of the music with the measured voltage, causing the music to be increasingly frenetic as your arm is flexing. To add to the Christmas cheer, we used FM synthesis to modulate the sounds played for each note, which mimics different musical instruments. These instruments include plucked strings, drums, snares, chimes, and more. To allow the user to play with the different instruments when making their song, we included the ability to change the instrument via a keypad.
Hardware Design

Bio Instrumentation Circuit

For our hardware design, we were influenced by many sources to come up with our design and testing strategy.
First, we started with a three-electrode setup to measure the muscle voltage changes effectively. This is a traditional surface electrode setup to use three different electrodes as ground, and two as the testing voltage difference inputs. We determined that this would be the most effective system after talking with Bruce Land about our overall goals and development ideas.
Then, based on multiple experiments conducted by other researchers (see references) we came up with a plan for making our signal conditioning system. The surface electrodes pick up EMG signals in the millivolt range and we wanted to determine the difference between the two working electrodes using the ground electrode as a reference. Then we needed to amplify and condition the signal so that the RP2040 could understand it later.
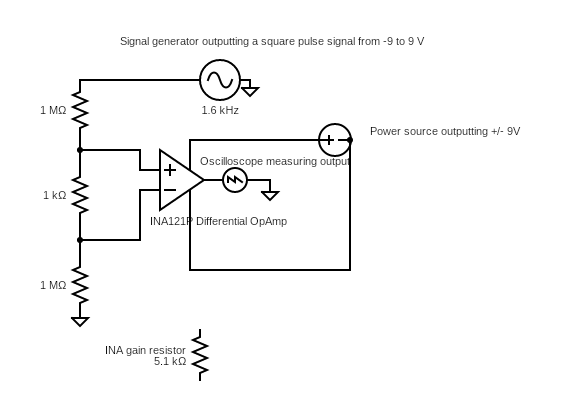
Using the two examples described in our background as starting points for our hardware, we worked with Bruce Land to come up with a good testing method using the oscilloscope and function generator before hooking it up to the electrodes and isolating the system. To simulate our EMG biological input of a few mV pulsing, we set the function generator to output a 1V sine wave and sent it through a voltage divider to have a 0.01 mV sine wave coming into our first opamp, the INA121. We decided to use the INA121 because it is a standard differential op amp that also has an amplification component so we figured it would be effective to determine the difference between the working electrodes. We also decided to power our system with the lab DC power source with a +/- 9V rail and a common ground. Then, to configure the INA121, we had to connect the positive and negative inputs from our voltage divider into the opamp, connect our +/- 9V rail to the V+ and V- components, add a reference ground which was connected to the power supply ground and function generator ground and include a gain resistor. We determined that a gain of 10 would be sufficient since we didn't want to amplify too much noise since we were not filtering the input signal before putting it in the opamp. To implement the gain of 10, we utilized a 5.1 kOhm resistor. Finally, to test that our opamp was working, we connected the oscilloscope to the output and measured it to ensure that it was conditioning the signal as expected. For our .01 mV sine wave input, we expected the output of the op-amp to look like a sine wave with an amplitude of around 0.1 mV because of the gain of 10. Below is a diagram of our first tester circuit as described above.
Figure 1: Test Circuit 1
When testing this first circuit, there were a couple of issues we ran into. First, we were getting strange outputs because the ground we connected to the op-amp was not connected throughout all the devices. In addition, when we were looking at the sine wave on the oscilloscope, there was a good amount of noise making the signal look fuzzy. To try to reduce the noise we were seeing, we wanted to implement a bandpass filter in our signal conditioning stage.
To start, we implemented a highpass filter after the INA 121 to try to remove some of the noise getting picked up from the signal acquisition. We utilized a capacitor-resistor combination to make a high-pass filter before passing it to our next op-amp, dual op-amp LM358. We used a 1 uF capacitor and 100 kOhm resistor to filter the lower frequency noise. Then we inputted the filtered output into the next op amp, an LM258 dual op-amp with 100 gain. We wanted to do 100 gain to have a system with 1000 gain overall to get it in the effective voltage range instead of 100 gain overall. We tested the system using the same method but with the oscilloscope at the output of the second op-amp.The circuit we tested is included in the figure below.
Figure 2: Test Circuit 2
The outputted waveform was in the 1V range since our system had a gain of 1000 at this point. The waveform outputted by the oscilloscope can be seen below.
Figure 3: Oscilloscope Output of Signal Conditioning Circuit
The next step in our hardware design was to implement the electrode system and give the system a floating ground to make it safe for testing on humans. We went through some trial and error to determine how to best read the signal being outputted by the signal conditioning system. We couldn't use the VGA, lab oscilloscope, lab monitors, or anything connected directly to ground.
First, we connected the system to Sofia's laptop using an audio jack connected to an audio adapter. Then we put the input into an oscilloscope app. We tested flexing our muscles with that system but the oscilloscope output was very sensitive to audio noise like clapping our hands near the speaker and it was unclear if the input from the electrodes was really working.
So we pivoted to using a mini oscilloscope LCD device given to us by Bruce Land. Once we wired the system to that device, it seemed to be working better but still had a lot of noise. Because it seemed to have a lot of distortion on a pretty large scale, we dropped the circuit gain on the second op-amp to just 10 instead of 100. This made our overall system have a gain of 100 instead of 1000. While we were testing it, we also saw a lot of extra noise added when we tried to plug it into the RP2040 GPIO 26 which is an ADC (analog to digital) input. After a lot of searching, we found that the source of the noise was that the system was not properly grounded throughout. This happened because we were using one of the breadboards that had a split connection in the middle rails so our ground rail was not connected all the way through. Another issue we saw was that there wasn't enough of a signal coming through unless we had really big muscle contractions. When we removed the low-pass filter, it fixed this issue and the signal got through. After we fixed this grounding issue and high-pass filter issue our electrodes were outputting expected signals but we did see that we needed to strategically place the electrode pads on large muscles to pick up the best signal spikes.
To connect the electrode output to the RP2040 for use in the Markov model, we connected it with GPIO 26 which we configured as an ADC input. This helps take in the analog signals being outputted by the electrodes and our signal conditioning circuit and converting it to digital signals the RP2040 can process. We used this information in the Markov model as described in the program design.
Audio Circuit

To make our audio circuit, first, we looked at how the MCP4822 Digital-to-Analog Converter works and how to integrate the pin-out with our Pico microcontroller. The DAC is a 12-bit analog-t
Technologies used
Hardware components
- RP2040
- LCD
- IMU
- speaker
- amplifier
- DAC
- ADC
Software & tools
- C
- Arduino IDE
Project demo video
What you get
- Working project / hardware kit, tested before delivery
- Complete source code with explanation
- Project demo and guidance for your viva
- Project report, PPT and IEEE paper support (on request)
Related Embedded Systems projects

Gas Leakage Detector Using Arduino
A budget-friendly LPG gas leak detector built with an Arduino and MQ-5 gas sensor, triggering a buzzer and LED when unsafe gas levels are de...
View project
Simple Alarm System
A beginner-friendly home alarm with PIR motion sensing, keypad PIN entry, and separate entry/exit timing delays, built to be easy to expand.
View project
Ultrasonic Sensor Project with Arduino UNO Q
A beginner-friendly first Arduino UNO Q project: a servo-swept ultrasonic sensor that renders a live sweeping radar display in a web browser...
View project
3D Audio Localization
[Fall 2025] We designed a real-time embedded system that localizes sound sources in three dimensions and visualizes them live using a four-m...
View project