Autocross Car Instrumentation
[Fall 2025] A plug and play device that can take your Auto-Cross racing experience to the next level.
- Suitable forB.Tech/B.E Embedded Systems students
- Build time4-6 weeks
- LevelBeginner
- Available atAjvika Labs, Kakinada
About this project
Table of Contents
Sound Bite
- One-sentence pitch of the project.
Summary
- What we built and what it does.
High-Level Design
- Architecture, rationale, math, tradeoffs.
Hardware
- Components, wiring, power, build process.
Software
- Software structure, parsing, UI, FSMs.
IP
- IP considerations.
Parts
- Bill of materials; estimated cost.
Results
- Scope traces, accuracy, performance, usability.
- Demo video, recorded by Hunter Adams.
Conclusion
- Outcomes and future improvements.
Appendix A
- Permissions for publishing and video.
Appendix B
- Hardware photos and pin diagrams.
Appendix C
- Static UI draw functions listing.
Appendix D
- Task breakdown by team member.
References
- References.
Sound Bite
A plug and play device that can take your Auto-Cross racing experience to the next level.
Summary
In this project we designed a device that can be plugged directly into the car. The system provides multiple important vitals to help aid your racing experience. The data collected is from a 6-DoF IMU which provides acceleration and gyroscope data. This constitutes the real-time G-Force meter that can help push your car to the limits. The project also includes a Neo-7M GPS chip with an active antenna for increased reception. This module adds to the device, allowing the driver to attain accurate 0-60mph (or 0-30) times. The acceleration and speed are used to create a function called “AutoCross” that measures time for autocross runs and automatically stops when the time-trial is complete.
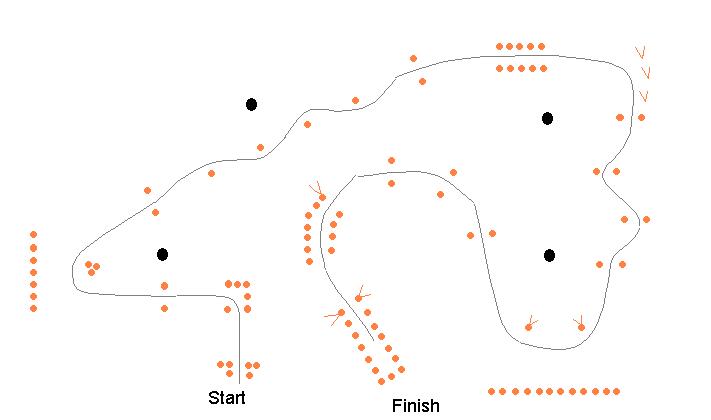
Figure 1: Example of Auto-Cross Circuit
High-Level Design
Rationale and Sources of Project Idea
One of the main inspirations for this project was the love of motorsports and cars that we both share. Andranik had gone to multiple Auto-Cross events in the Upstate New-York region and noticed the difficulty in tracking and improving on time-trial events. This led us to the idea of creating a racing-aid device that can plug into a car and get useful information for drivers. This can help drivers improve their times and understand their cars and driving in a quantitative manner.
Background Math
Some math was required in the scaling and creating of the G-Force meter. This included a thorough understanding of reference frames for the IMU module and the car in order to produce coherent data. There was also some easy math done to remove the bias from the “AutoCross” setting which simply demanded systematic subtraction of the settling time. There was also some math done to ensure a nice GUI system fit on our TFT screen.
Logical Structure
The logical structure of the device is quite simple. We have the central Microcontroller which branches out to our 3 peripherals: the IMU, the TFT screen, the GPS module with the active antenna. The IMU and GPS module send raw data to the microcontroller which completes a set of instructions and calculations which are then sent to be displayed on the screen.
Hardware/Software Tradeoffs
Our biggest hardware/software tradeoff was deciding which tasks should be handled by dedicated peripherals and which should be handled in software on the RP2040. We chose a discrete TFT module with a PIO-based driver (TFTMaster) to keep hardware simple and low-cost. This change required more careful software-side rendering patterns (static redraw + incremental patch updates) to avoid flicker and keep the UI responsive. We also used a rotary encoder and button instead of a touchscreen to reduce hardware complexity and cost. This came at the cost of more complexity in software via quadrature decoding, debouncing, and UI state machines.
Another key tradeoff was timing and concurrency. We implemented the system as a single polling loop (IMU read/filter, GPS UART buffering/parsing, knob decode, UI updates) with only PPS handled by interrupt. This approach simplified software integration/debugging and avoided multi-thread timing bugs, but it also meant some operations (like buzzer countdown beeps using
sleep_ms()
) are blocking. For our use case this was deemed acceptable because the beeps are short and occur during a user-visible countdown, but in later iterations we would likely move buzzer timing to a non-blocking state machine or use timer alarm callbacks.
Finally, we balanced accuracy versus implementation complexity. For IMU-derived visuals (G-Force meter), we prioritized stability and readability on the TFT by applying a simple first-order low-pass filter in software, rather than implementing more complex features that would require more tuning and more computation. For GPS, we relied on the module’s NMEA output (1 Hz) rather than increasing the update rate. This would again likely be changed if we had more time, or in future iterations. These choices kept hardware plug-and-play and minimized wiring, at the cost of slower speed refresh compared to vehicle bus data. In summary, we made decisions to best keep the device low-power, portable, and easy to integrate, while still achieving the intended demo performance.
Hardware Spec/Process
The hardware utilized for this project was reverse engineered from the features we wanted our device to implement. We drew from our experience working with the MPU 6050 IMU in lab 3 of the course. We also drew inspiration from the dashboard of many top-end racing vehicles like the Porsche 911 which contains an in-built g-force meter on a circular axis similar to ours. The code implementation of the g-force meter is in the Commented Code sections, but in terms of hardware we knew that this feature could be implemented with just the IMU. Next when working on the AutoCross function, which uses the IMU, we had the idea to use a lower bound to predict that the vehicle had finished the racing course. However; when thinking about the start of the AutoCross function, we wanted to allow the driver to focus on the car and not have to look at the display count-down. For this reason, we added a simple active buzzer which produced a short sound on 3,2,1 and then a longer sound to signal “Go!” This allows the driver to focus on the road and start immediately after the long buzzer. The hardware of the long buzzer was quite simple to implement, as it was low power, we simply connected it to GPIO 21 (Physical pin 27) and the pin was able to supply enough power to sound the buzzer.
We wanted a low power option of displaying all of the data and performance metrics, and under the guidance of Hunter Adams, we decided to use a 2.2” TFT display. The physical pin wiring schematic can be found in
Appendix B
below.
The GPS chip was the next main component we added to our device. The actual wiring of the chip was quite simple and we made sure to utilize a ship that could run on 3.3V. This allowed us to power the chip directly from the RP2040. The data being communicated between the GPS chip and the RP 2040 was done through the UART protocol. This implied that from a hardware perspective, the TX of the GPS chip is connected to the UART RX1 of the RP 2040 (physical pin 7). Then the RX of the GPS chip is connected to the UART TX1 (physical pin 6). The main issue with the GPS antenna with passive antennas is that they are very difficult to fix to satellites. It was only after a trip to the Hartung-Boothroyd Observatory that (about 15 minutes outside of Ithaca) we were able to attain an initial fix. After this point the GPS had a “hot start” and was able to fix satellites in about 15 seconds when placed in the car. We then further improved by ordering a simple active antenna which was magnetic and allowed us to keep the device on the dash and the active antenna clinged to the roof. This led to an even faster fix and more confidence when driving through more crowded areas outside.
Figure 2: Attaining a Satellite Fix at Hartung-Boothroyd Observatory
The wiring of the IMU was done in a similar fashion to lab 3 of this course and the physical pin wiring diagram can be seen in the schematic appendix below.
Since we are not planning on using the serial communication with the deconder, we need some way to navigate the GUI. This is where we decided to use a knob (rotary encoder) with a button to allow for a simple yet effective way of interacting with the device. Once again, the physical pin wiring diagram is in the appendix below.
Next, a short discussion of the power dynamics is appropriate. As mentioned above, we wanted to maximize the usability of this device across all types of cars. The reliable power source found in almost all cars produced in the last 60 years is the 12V cigarette lighter. We first found a plug in adapter that you can plug in the 12V adapter, with a simple On/Off switch the yields two wires, a positive +12V and ground. These wires were then soldered and heat shrunk directly into the input of a DC/DC converter which outputs 3.3V see
[Figure 5]
. The output of the DC/DC converter which was confirmed to be around 3.3V was fed into the VSYS pin (physical pin 39) By reading through the data sheets of the various components we used, we made sure to only use components that needed 3.3V. This allowed for the creation of one large power, and ground rail. The 3V3OUT pin (physical pin 36) of the RP 2040 was connected to main power rail running down both universal PCBs. This allowed for simple connections to be made between the modules and the main power rail. The GND pin (physical pin 38) was also connected to the main GND of the system and shorted across the two universal PCBs and allowed for easy GND connections to each peripheral.
Finally,
Appendix B
contains an image of our “in process” circuit which we built on a standard breadboard with standard plug in wires. This led to a very crowded working environment which was difficult to work with. We also noticed that the screen would flicker significantly and we had a fear that placing it in the car could have detrimental effects. Thus to increase the build quality we switched to a universal PCB and soldered all of the connections. This completely solved the flicke
Sound Bite
- One-sentence pitch of the project.
Summary
- What we built and what it does.
High-Level Design
- Architecture, rationale, math, tradeoffs.
Hardware
- Components, wiring, power, build process.
Software
- Software structure, parsing, UI, FSMs.
IP
- IP considerations.
Parts
- Bill of materials; estimated cost.
Results
- Scope traces, accuracy, performance, usability.
- Demo video, recorded by Hunter Adams.
Conclusion
- Outcomes and future improvements.
Appendix A
- Permissions for publishing and video.
Appendix B
- Hardware photos and pin diagrams.
Appendix C
- Static UI draw functions listing.
Appendix D
- Task breakdown by team member.
References
- References.
Sound Bite
A plug and play device that can take your Auto-Cross racing experience to the next level.
Summary
In this project we designed a device that can be plugged directly into the car. The system provides multiple important vitals to help aid your racing experience. The data collected is from a 6-DoF IMU which provides acceleration and gyroscope data. This constitutes the real-time G-Force meter that can help push your car to the limits. The project also includes a Neo-7M GPS chip with an active antenna for increased reception. This module adds to the device, allowing the driver to attain accurate 0-60mph (or 0-30) times. The acceleration and speed are used to create a function called “AutoCross” that measures time for autocross runs and automatically stops when the time-trial is complete.
Figure 1: Example of Auto-Cross Circuit
High-Level Design
Rationale and Sources of Project Idea
One of the main inspirations for this project was the love of motorsports and cars that we both share. Andranik had gone to multiple Auto-Cross events in the Upstate New-York region and noticed the difficulty in tracking and improving on time-trial events. This led us to the idea of creating a racing-aid device that can plug into a car and get useful information for drivers. This can help drivers improve their times and understand their cars and driving in a quantitative manner.
Background Math
Some math was required in the scaling and creating of the G-Force meter. This included a thorough understanding of reference frames for the IMU module and the car in order to produce coherent data. There was also some easy math done to remove the bias from the “AutoCross” setting which simply demanded systematic subtraction of the settling time. There was also some math done to ensure a nice GUI system fit on our TFT screen.
Logical Structure
The logical structure of the device is quite simple. We have the central Microcontroller which branches out to our 3 peripherals: the IMU, the TFT screen, the GPS module with the active antenna. The IMU and GPS module send raw data to the microcontroller which completes a set of instructions and calculations which are then sent to be displayed on the screen.
Hardware/Software Tradeoffs
Our biggest hardware/software tradeoff was deciding which tasks should be handled by dedicated peripherals and which should be handled in software on the RP2040. We chose a discrete TFT module with a PIO-based driver (TFTMaster) to keep hardware simple and low-cost. This change required more careful software-side rendering patterns (static redraw + incremental patch updates) to avoid flicker and keep the UI responsive. We also used a rotary encoder and button instead of a touchscreen to reduce hardware complexity and cost. This came at the cost of more complexity in software via quadrature decoding, debouncing, and UI state machines.
Another key tradeoff was timing and concurrency. We implemented the system as a single polling loop (IMU read/filter, GPS UART buffering/parsing, knob decode, UI updates) with only PPS handled by interrupt. This approach simplified software integration/debugging and avoided multi-thread timing bugs, but it also meant some operations (like buzzer countdown beeps using
sleep_ms()
) are blocking. For our use case this was deemed acceptable because the beeps are short and occur during a user-visible countdown, but in later iterations we would likely move buzzer timing to a non-blocking state machine or use timer alarm callbacks.
Finally, we balanced accuracy versus implementation complexity. For IMU-derived visuals (G-Force meter), we prioritized stability and readability on the TFT by applying a simple first-order low-pass filter in software, rather than implementing more complex features that would require more tuning and more computation. For GPS, we relied on the module’s NMEA output (1 Hz) rather than increasing the update rate. This would again likely be changed if we had more time, or in future iterations. These choices kept hardware plug-and-play and minimized wiring, at the cost of slower speed refresh compared to vehicle bus data. In summary, we made decisions to best keep the device low-power, portable, and easy to integrate, while still achieving the intended demo performance.
Hardware Spec/Process
The hardware utilized for this project was reverse engineered from the features we wanted our device to implement. We drew from our experience working with the MPU 6050 IMU in lab 3 of the course. We also drew inspiration from the dashboard of many top-end racing vehicles like the Porsche 911 which contains an in-built g-force meter on a circular axis similar to ours. The code implementation of the g-force meter is in the Commented Code sections, but in terms of hardware we knew that this feature could be implemented with just the IMU. Next when working on the AutoCross function, which uses the IMU, we had the idea to use a lower bound to predict that the vehicle had finished the racing course. However; when thinking about the start of the AutoCross function, we wanted to allow the driver to focus on the car and not have to look at the display count-down. For this reason, we added a simple active buzzer which produced a short sound on 3,2,1 and then a longer sound to signal “Go!” This allows the driver to focus on the road and start immediately after the long buzzer. The hardware of the long buzzer was quite simple to implement, as it was low power, we simply connected it to GPIO 21 (Physical pin 27) and the pin was able to supply enough power to sound the buzzer.
We wanted a low power option of displaying all of the data and performance metrics, and under the guidance of Hunter Adams, we decided to use a 2.2” TFT display. The physical pin wiring schematic can be found in
Appendix B
below.
The GPS chip was the next main component we added to our device. The actual wiring of the chip was quite simple and we made sure to utilize a ship that could run on 3.3V. This allowed us to power the chip directly from the RP2040. The data being communicated between the GPS chip and the RP 2040 was done through the UART protocol. This implied that from a hardware perspective, the TX of the GPS chip is connected to the UART RX1 of the RP 2040 (physical pin 7). Then the RX of the GPS chip is connected to the UART TX1 (physical pin 6). The main issue with the GPS antenna with passive antennas is that they are very difficult to fix to satellites. It was only after a trip to the Hartung-Boothroyd Observatory that (about 15 minutes outside of Ithaca) we were able to attain an initial fix. After this point the GPS had a “hot start” and was able to fix satellites in about 15 seconds when placed in the car. We then further improved by ordering a simple active antenna which was magnetic and allowed us to keep the device on the dash and the active antenna clinged to the roof. This led to an even faster fix and more confidence when driving through more crowded areas outside.
Figure 2: Attaining a Satellite Fix at Hartung-Boothroyd Observatory
The wiring of the IMU was done in a similar fashion to lab 3 of this course and the physical pin wiring diagram can be seen in the schematic appendix below.
Since we are not planning on using the serial communication with the deconder, we need some way to navigate the GUI. This is where we decided to use a knob (rotary encoder) with a button to allow for a simple yet effective way of interacting with the device. Once again, the physical pin wiring diagram is in the appendix below.
Next, a short discussion of the power dynamics is appropriate. As mentioned above, we wanted to maximize the usability of this device across all types of cars. The reliable power source found in almost all cars produced in the last 60 years is the 12V cigarette lighter. We first found a plug in adapter that you can plug in the 12V adapter, with a simple On/Off switch the yields two wires, a positive +12V and ground. These wires were then soldered and heat shrunk directly into the input of a DC/DC converter which outputs 3.3V see
[Figure 5]
. The output of the DC/DC converter which was confirmed to be around 3.3V was fed into the VSYS pin (physical pin 39) By reading through the data sheets of the various components we used, we made sure to only use components that needed 3.3V. This allowed for the creation of one large power, and ground rail. The 3V3OUT pin (physical pin 36) of the RP 2040 was connected to main power rail running down both universal PCBs. This allowed for simple connections to be made between the modules and the main power rail. The GND pin (physical pin 38) was also connected to the main GND of the system and shorted across the two universal PCBs and allowed for easy GND connections to each peripheral.
Finally,
Appendix B
contains an image of our “in process” circuit which we built on a standard breadboard with standard plug in wires. This led to a very crowded working environment which was difficult to work with. We also noticed that the screen would flicker significantly and we had a fear that placing it in the car could have detrimental effects. Thus to increase the build quality we switched to a universal PCB and soldered all of the connections. This completely solved the flicke
Technologies used
Hardware components
- RP2040
- TFT display
- IMU
- gyroscope
- GPS module
Software & tools
- C
- Arduino IDE
Project demo video
What you get
- Working project / hardware kit, tested before delivery
- Complete source code with explanation
- Project demo and guidance for your viva
- Project report, PPT and IEEE paper support (on request)
Delivery & Payment
Delivery takes a minimum of two weeks from the date your inquiry is confirmed.
Payment is in two parts:
• 50% advance to start the project
• Remaining 50% before delivery
Note:
• Documentation and PPT are not included by default
• If you need documentation/PPT, it can be arranged for extra time and cost
We'll confirm the exact timeline and cost with you after reviewing your requirements.
Related Embedded Systems projects

Embedded Systems
Gas Leakage Detector Using Arduino
A budget-friendly LPG gas leak detector built with an Arduino and MQ-5 gas sensor, triggering a buzzer and LED when unsafe gas levels are de...
View project
Embedded Systems
Simple Alarm System
A beginner-friendly home alarm with PIR motion sensing, keypad PIN entry, and separate entry/exit timing delays, built to be easy to expand.
View project
Embedded Systems
Ultrasonic Sensor Project with Arduino UNO Q
A beginner-friendly first Arduino UNO Q project: a servo-swept ultrasonic sensor that renders a live sweeping radar display in a web browser...
View project
Embedded Systems
3D Audio Localization
[Fall 2025] We designed a real-time embedded system that localizes sound sources in three dimensions and visualizes them live using a four-m...
View project