


IoT based Air Pollution Monitoring System using Arduino
In this project we are going to make an IOT Based Air Pollution Monitoring System in which we will monitor the Air Quality over a webserver using internet and will trigger a alarm when the air quality goes down beyond a certain level
- Suitable forB.Tech IoT students
- Build time3-4 weeks
- LevelIntermediate
- Available atAjvika Labs, Kakinada
About this project
Previously, we have built the LPG detector using the MQ6 sensor, the Smoke detector using the MQ2 sensor, and the Air Quality Analyser, but this time we have used the MQ135 sensor as the air quality sensor, which is the best choice for monitoring Air Quality as it can detect most harmful gases and can measure their amount accurately. In this IOT project, you can monitor the pollution level from anywhere using your computer or mobile. We can install this system anywhere and can also trigger some device when pollution goes beyond some level, like we can switch on the Exhaust fan or send an alert SMS/mail to the user. This complete guide explains how to build IoT based air pollution monitoring system that can provide real-time air pollution monitoring on a web platform based on Arduino. This air pollution monitoring system project detects harmful gases such as CO2, smoke, alcohol, benzene and NH3, displaying air quality levels in PPM (parts per million) on an LCD and on a web dashboard for remote monitoring. Rather than just detecting air quality sensors, this air pollution monitoring system using IoT can detect a comprehensive variety of environmental elements integrated into a web-based visualisation.
Air Pollution Monitoring System Features
└ ESP8266 to Arduino Pin Connections
└ LCD Display Wiring for Local Monitoring
Code Implementation and Explanation
Advanced Features and Upgrades
Air Pollution Monitoring System Features
Required Components for Air Pollution Monitoring System Project
Wi-Fi module ESP8266
You can buy all the above components from here.
Block Diagram of Air Pollution Monitoring System
First of all, we will connect the ESP8266 to the Arduino. ESP8266 runs on 3.3V, and if you give it 5V from the Arduino, then it won’t work properly, and it may get damaged. Connect the VCC and the CH_PD to the 3.3V pin of the Arduino. The RX pin of the ESP8266 works on 3.3V, and it will not communicate with the Arduino when we connect it directly to the Arduino. So, we will have to make a voltage divider for it, which will convert the 5V into 3.3V. This can be done by connecting three resistors in series, like we did in the circuit. Connect the TX pin of the ESP8266 to pin 10 of the Arduino and the RX pin of the ESP8266 to pin 9 of the Arduino through the resistors. The ESP8266 module is crucial for IoT functionality in our air pollution monitoring system using IoT.
ESP8266 Wi-Fi module gives your projects access to Wi-Fi or the internet. It is a very cheap device and makes your projects very powerful. It can communicate with any microcontroller, and it is the leading device in the IOT platform. Learn more about using ESP8266 with Arduino here.
Then we will connect the MQ135 sensor with the Arduino. Connect the VCC and the ground pin of the sensor to the 5V and ground of the Arduino, and the Analog pin of the sensor to the A0 of the Arduino.
Connect a buzzer to pin 8 of the Arduino, which will start to beep when the condition becomes true.
Lastly, we will connect the LCD with the Arduino. The connections of the LCD are as follows
Connect pin 1 (VEE) to the ground.
Connect pin 2 (VDD or VCC) to the 5V.
Connect pin 3 (V0) to the middle pin of the 10K potentiometer, and connect the other two ends of the potentiometer to the VCC and the GND. The potentiometer is used to control the screen contrast of the LCD. Potentiometers with values other than 10K will work too.
Connect pin 4 (RS) to pin 12 of the Arduino.
Connect pin 5 (Read/Write) to the ground of the Arduino. This pin is not often used, so we will connect it to the ground.
Connect pin 6 (E) to pin 11 of the Arduino. The RS and E pins are the control pins which are used to send data and characters.
The following four pins are data pins which are used to communicate with the Arduino.
Connect pin 11 (D4) to pin 5 of the Arduino.
Connect pin 12 (D5) to pin 4 of the Arduino.
Connect pin 13 (D6) to pin 3 of the Arduino.
Connect pin 14 (D7) to pin 2 of the Arduino.
Connect pin 15 to the VCC through the 220 ohm resistor. The resistor will be used to set the back-light brightness. Larger values will make the backlight much darker.
Connect pin 16 to the Ground.
Working Principle of Real-Time Air Pollution Monitoring System
Our IoT based air pollution monitoring system operates on advanced gas sensing technology combined with wireless data transmission for comprehensive environmental monitoring. The MQ135 sensor is the heart of our real-time air pollution monitoring system. The MQ135 sensor can sense NH3, NOx, alcohol, Benzene, smoke, CO2 and some other gases, so it is a perfect gas sensor for our Air Quality Monitoring Project. When we connect it to Arduino, then it will sense the gases, and we will get the Pollution level in PPM (parts per million). The MQ135 gas sensor gives the output in the form of voltage levels, and we need to convert it into PPM. So, for converting the output in PPM, here we have used a library for the MQ135 sensor, which is explained in detail in the “Code Explanation” section below.
The sensor was giving us a value of 90 when there was no gas near it, and the safe level of air quality is 350 PPM, and it should not exceed 1000 PPM. When it exceeds the limit of 1000 PPM, then it starts causing Headaches, sleepiness and stagnant, stale, stuffy air, and if it exceeds 2000 PPM, then it can cause increased heart rate and many other diseases.
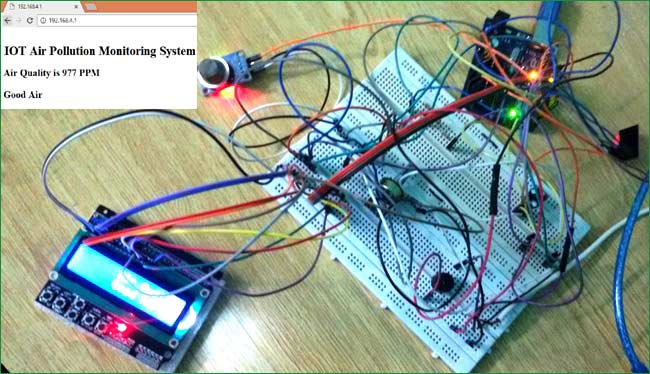
When the value is less than 1000 PPM, then the LCD and webpage will display “Fresh Air”. Whenever the value increases 1000 PPM, then the buzzer will start beeping and the LCD and webpage will display “Poor Air, Open Windows”. If it will increase 2000, then the buzzer will keep beeping and the LCD and webpage will display “Danger! Move to fresh Air”.
Complete Code Implementation and Explanation
Before beginning the coding for this project, we need to first calibrate the MQ135 Gas sensor. There are lots of calculations involved in converting the output of the sensor into a PPM value. We have done this calculation before in our previous Smoke Detector project. But here we are using the Library for MQ135, you can download and install this MQ135 library from here: https://github.com/GeorgK/MQ135. Before implementing the main air pollution monitoring system project, proper sensor calibration is essential for accurate readings.
Using this library, you can directly get the PPM values by just using the two lines below:
But before that, we need to calibrate the MQ135 sensor. For calibrating the sensor, upload the code below and let it run for 12 to 24 hours and then get the RZERO value.
After getting the RZERO value. Put the RZERO value in the library file you downloaded, \"MQ135.h\": #define RZERO 494.63
Now we can begin the actual code for our Air quality monitoring project.
In the code, first of all, we have defined the libraries and the variables for the Gas sensor and the LCD. By using the Software Serial Library, we can make any digital pin a TX and RX pin. In this code, we have made Pin 9 the RX pin and Pin 10 the TX pin for the ESP8266. Then we have included the library for the LCD and have defined the pins for the same. We have also defined two more variables: one for the sensor analog pin and the other for storing air_quality value.
Then we will declare pin 8 as the output pin where we have connected the buzzer. l cd.begin(16,2) command will start the LCD to receive data, and then we will set the cursor to the first line and print the ‘circuitdigest’. Then we will set the cursor on the second line and print ‘Sensor Warming’.
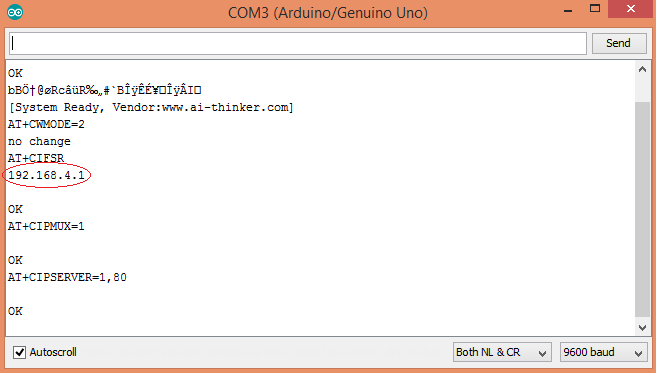
Then we will set the baud rate for the serial communication. Different ESPs have different baud rates, so write it according to your ESP’s baud rate. Then we will send the commands to set the ESP to communicate with the Arduino and show the IP address on the serial monitor.
For printing the output on the webpage in a web browser, we will have to use HTML programming. So, we have created a string named webpage and stored the output in it. We are subtracting 48 from the output because the read() function returns the ASCII decimal value, and the first decimal number, which is 0, starts at 48.
The following code will call a function named sendData and will send the data & message strings to the webpage to show.
The following code will print the data on the LCD. We have applied various conditions for checking air quality, and the LCD will print the messages according to conditions, and the buzzer will also beep if the pollution goes beyond 1000 PPM.
Finally, the below function will send and show the data on the webpage. The data we stored in a string named ‘webpage’ will be saved in a string named ‘command’. The ESP will then read the character one by one from the ‘command’ and will print it on the webpage.
Testing and Output of the Project
Before uploading the code, make sure that you are connected to the Wi-Fi of your ESP8266 device. After uploading, open the serial monitor, and it will show the IP address as shown below.
Type this IP address in your browser, and it will show you the output as shown below. You will have to refresh the page again if you want to see the current Air Quality Value in PPM.
We have set up a local server to demonstrate its working; you can check the Video below. But to monitor the air quality from anywhere in the world, you need to forward port 80 (used for HTTP or internet) to your local or private IP address (192.168*) of your device. After port forwarding, all the incoming connections will be forwarded to this local address, and you can open the above-mentioned webpage by just entering the public IP address of your internet from anywhere. You can forward the port by logging into your router (192.168.1.1) and finding the option to set up port forwarding.
Advanced Features and Upgrades
Enhance your air pollution monitoring system using IoT with these additional features:
Technical Summary and GitHub Repository
The Technical Summary is designed to give readers a concise overview of the system and its workflow. It provides a quick reference to the design approach, hardware interfacing, and execution steps. The GitHub Repository complements this with full access to code, libraries, and schematics.
This tutorial provides a step-by-step construction of a simple air-pollution monitoring system based on IoT technology using easy-to-find components. The project successfully achieves the combination of sensor technology, microcontroller programming, and IoT connectivity to realise a good, real-time air pollution monitoring system available for various types of applications. The air pollution monitoring system project serves as an excellent foundation for environmental monitoring applications, smart city initiatives, and educational projects.
» Monitor air quality in real time through a web interface » Provide multi-level alerts for health safety » Provide a very low-cost solution through the use of Arduino » Scalable system for multiple deployment scenarios
Frequently Asked Questions - Air Pollution Monitoring System
⇥ 1. To properly calibrate the MQ135 sensor for accurate PPM readings, what do I do? You should leave the calibration code running for approximately 12-24 hours in clean air to determine the RZERO reading. You will need to update this value in the MQ135.h library file. Again, calibrating once a month will provide the most accurate readings.
⇥ 2. What is the expected power consumption for this IoT monitoring system? The entire system will consume approximately 250-300mA at 5V, which is around 1.25-1.5 watts. If you plan to deploy this outdoors for an extended period of time, consider using a 2A power supply or solar panel.
Technologies used
Hardware components
- ESP32
- ESP8266
- Arduino
- DHT22
- Relay
- OLED
- NodeMCU
Software & tools
- Arduino IDE
- Blynk
- Firebase Console
- Node-RED
- MQTT Broker
Project demo video
What you get
- Working project / hardware kit, tested before delivery
- Complete source code with explanation
- Project demo and guidance for your viva
- Project report, PPT and IEEE paper support (on request)
Related IoT projects

DIY IoT Plant Watering System using Arduino
A remote plant-watering system that monitors soil moisture and lets you trigger a water pump from anywhere through the Blynk app, with LED-m...
View project
Build a smart mirror with an Arduino UNO Q
A wall-mounted smart mirror that shows the time, calendar, to-do list, room temperature/humidity and weather forecast behind a two-way glass...
View project
ESP32 Patient Health Monitor ECG SpO2 BPM Live Dashboard
Build a complete patient health monitoring system using ESP32 with AD8232 ECG sensor, MAX30102 pulse oximeter, BME280 and live web dashboard...
View project
IoT AC Energy Meter with PZEM-004T and ESP32 WebServer
Build an IoT-based AC energy meter using ESP32 and PZEM-004T to measure voltage, current, power, frequency and energy with live web dashboar...
View project