



How to use Edge Impulse Signal based Model Training to train a Fever Detection Model
In this tutorial we are going to use Edge Impulse Studio to train a simple signal-based model to identify if a person has a fever or not. We will be using the Arduino Nano 33 IoT as it can be easily integrated with the library exported by edge impulse. For this project, we will integrate the MLX90614 sensor to measure the temperature of a person’s finger and predict if he/she has a fever or not.
- Suitable forB.Tech AI students
- Build time4-6 weeks
- LevelAdvanced
- Available atAjvika Labs, Kakinada
About this project
Not just this, even for a simple application the model training might require hours or days. Given the current silicon shortage and skyrocketing GPU prices, this might prove to be a big roadblock for any practical application that the maker might want to automate or develop as a model. Edge Impulse aims to address these concerns. Edge Impulse studio can be used to easily train machine learning models like Object Classification, Cough Detection, Speech Recognition, and many more. In this tutorial, we are going to use Edge Impulse Studio to train a simple signal-based model to identify if a person has a fever or not. Learn by building innovative artificial intelligence projects with detailed guides and working examples.
What is Edge Impulse?
Edge impulse helps makers to speed up the entire process of interfacing the hardware, collecting data from it, pre-processing it, and then building a model with it from days or months to a few hours. It is free for personal projects and extremely convenient to use. It has an intuitive UI that guides you through the steps of model building without exposing you to unnecessary complexity. At the same time, it makes sure to provide you with enough options to collect/upload your own data and customize the entire model and its training process. Finally, it can also provide you with extremely integrable TensorFlow-lite model libraries in all popular formats so that you can run inference on the go.
Why Use Edge Impulse Models for Signals?
We will be using the Arduino Nano 33 IoT as it can be easily integrated with the library exported by edge impulse. For this project, we will integrate the MLX90614 sensor to measure the temperature of a person’s finger and predict if he/she has a fever or not. While at first thought it might be a simple case of thresholding, I assure you it is not. Why? Simply because of the following reasons:
Ambient Temperature and distance between the finger and the mlx sensor significantly change the measured value of the object temperature.
The same person might have slightly different core body temperatures on different days
Different people of different ethnic backgrounds also have different emissivities and slightly different core temperatures
The temperature of a finger is a few degrees lower than the core body temperature
So, while theoretically, the temperature at which fever is considered to have set is around 100 degF according to modern standards, just thresholding the measured object temperature value will give a lot of false readings affecting your model’s accuracy.
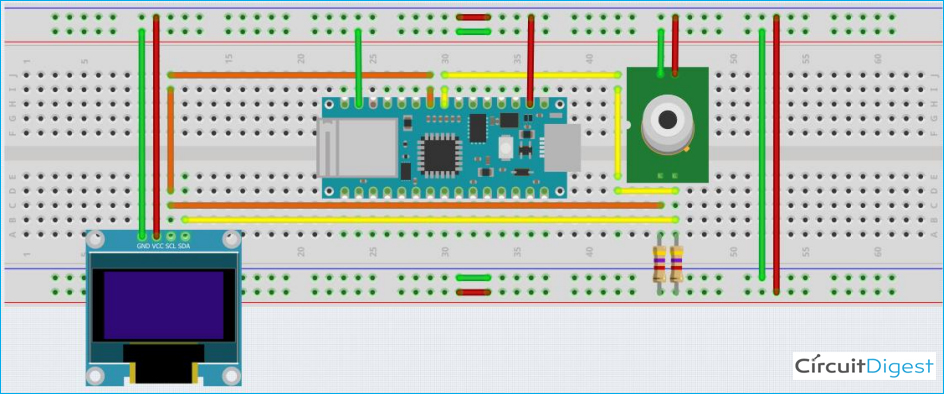
Circuit Diagram for Interfacing MLX90614 with Arduino Nano 33 IoT
The schematic is very simple. We will be using the mlx90614 and a 1.3” OLED I2C display. The connections are very simple as both the modules (MLX90614 & OLED display) works on I2C.
Display/MLX90614 sensor
Training a Fever Detection Model with Edge Impulse Studio
Training a Machine Learning model with Edge Impulse is very simple and can be completed in 7-8 steps. All the steps for Training a model with Edge Impulse are explained below:
1. Register on the website and create your project
The first step is to register on the edge Impulse website. After registration, you will see the Dashboard screen which will show you the basic workflow of model development at edge impulse. You will be asked to create and name a new project. As mentioned under project info, select the Labelling method to be “one label per data item” and the Latency calculations to Cortex-M4F 80 MHz. For vision-based models, you can select the bounding boxes option. There are a lot of other processors and boards fully supported by the edge impulse platform, like the Spresense kit, ST discovery IoT kit, etc. In the danger zone, there is an option called rebalance dataset, which will divide your training and test data in an 80:20 percentage ratio.
2. Data Collection using Data-Forwarder
Now the second step is collecting the data for model training. If you click on the “LET’S COLLECT SOME DATA” button, you will see a variety of options.
We will use the data-forwarder option, which uses python3, node.js, and cli to collect data from your hardware device and then relay the collected hardware to the edge impulse platform. After setting up the edge impulse data forwarder using this page of the official edge impulse installation documentation: https://docs.edgeimpulse.com/docs/cli-installation, first, upload the data collection script provided to your Arduino 33 IOT board setup. With the device still plugged into your Laptop/Desktop, open a cmd or terminal with admin or sudo rights and type the following command:
The data forwarder should then respond accordingly:
Enter the valid registration credentials, name of the project you just created, and name the 2 axes that are detected as O_Temp and A_Temp respectively. The data frequency should be detected automatically. This is how it will look-
If you move back to the edge impulse UI, you should see the name of the just added device as shown below-
The green dot indicates that the device is active and plugged. Now, select the Data acquisition tab on the left and you will be able to see the following page:
Enter the desired sample length and then click on the Start Sampling button. The counter should start in place of the sampling button just pressed and after the entered time has elapsed, the data collected will be displayed as shown. You can rename the sample and change its label by clicking on the 3 dots at the right of each collected sample. To visualize the sample collected, just click on it.
Collect at least 9 minutes of data, equally divided into three classes – No finger, healthy, and fever.
Collect 1 sample of 100 seconds each for all three labels on each day for multiple days, so that your model works for a variety of ambient temperatures.
For the first class, just remove your finger over the sensor and let it be as is. In the second case, keep your finger 1 cm away from the sensor and for the fever label, touch your finger to the sensor.
Use The oled display should show you the temperature that is being measured by the sensor.
Fingers are 5-6 degF lower than core body temperature, and we are assuming the fever threshold to be 100 degF.
You can also collect test data by selecting the “Test data” tab beside the “Training data” tab currently selected. You can also use the rebalance data button and divide the dataset automatically in an 80:20 ratio.
For test data, 100-second sample length should be convenient and for test data, 10-second sample length should be convenient.
Edge Impulse allows you to split and crop your samples as well so remove any spikes or erroneous data before proceeding further.
3. Creating an Impulse
Impulses are used to train the model from the collected signal values. Select the Impulse design tab on the left and you will see a new page. Set it up to look as follows-
Look at the various options and blocks available. You can choose the blocks as per your data and even select the axes you want to train the data on. Edge impulse explains each block and its general use case. We will be using raw data as it allows us to directly feed the values from our sensor to the model’s API and also saves processing time. Keep the frequency to two hertz. This will mean that we will feed sensor data to the model every 500ms. Note that this does not mean we will be reading data from the sensor at the same rate. We might read the data faster just to average it out before feeding it to the model. Hence, our sample length will be 1/frequency or 500ms. With a window size of 500ms, we will run inference on 500ms length of data together, which in our case is the length of a single sample. The more the window size, the more the samples that will be classified together, the more will be the feature list. To avoid complications, we will classify each sample separately. Keep both – O_Temp and A_Temp checked in the raw data block as we want our model to work at various ambient temperatures.
4. Generating Features
Now we move on to create features from our raw data. Under impulse design, once you have saved the impulse you just created, the circle beside “Create impulse” should turn green indicating your impulse has been created. You should also see additional tabs like “Raw data” depending on the blocks you have added. When you click on the raw data tab, the following page should open –
You can use the drop-down on the top right to select which collected training sample you want to see. Below the visualization, you can see two types of features – raw and DSP. DSP features are not of importance in this project hence we will shed light on them later. The raw features if you look closely are nothing but O_Temp, A_Temp or 1 sample which we are collecting. This seems to be correct as we had used a frequency of 2 and a window size of 500 ms. On the Topmost tab select “Generate features” which will lead to this page-
You will not be seeing any graph because we have not yet generated any features. Click on the “Generate features” button and you will see that edge impulse has started learning features from the collected data. It basically runs a K-means algorithm, clustering data having the same label together. You should be able to see a 3D graph on the right, with all the different labels in different colors. Once this is done, we can now proceed to training the model.
5. Model Architecture and Training
Select the NN Classifier tab on the left. You will be able to see the window shown below, keep the default settings as it is or modify them a bit as I have done. Click on start training and within a few minutes, you should have 50 epochs done, showing you the accuracy of the model. Since this is a relatively simple problem, we should see a very high accuracy of >98%.
6. Testing the model on test samples
After this, we can check how well the model is performing using the live classification tab.
You can take a new sample by attaching the registered data collection device using the data forwarder or you can classify an existing test sample.
You will be able to see how well each window of the new/test sample has been classified visually and in a report-like format under the “Detailed result” section.
7. Calculating Test Accuracy
Now we will see how the model performs on the test data we have collected overall. Select the “Model testing” tab and press the “Classify all” button.
You should see the test accuracies in the form of a confusion matrix.
8. Versioning and Deployment
Versioning will help you create multiple versions of the same model and project. Finally, we move on to the Deployment tab. Select the Arduino library option under create a library and then go down. You will see the available optimization options for the NN classifier. Press on the Analyze optimizations button to see which optimization is better. In our case, float32 performs better hence we will build the library using that.
Click on the build button and a zip file should automatically start downloading.
Congratulations! You have successfully built your first edge impulse model!
Deploying the Trained Model on Arduino Nano 33 IoT
Now we will use the downloaded library to classify samples in real-time. The first step is to open the Arduino IDE, go to the “Sketch” tab, select “Include Library” and import it as a .zip file. This should add it to the libraries folder inside your sketch directory. You should be able to see the library in the examples folder. Our inference file is a modification of the static_buffer example. If you remember, during the step 4 when we generated features, we could see 2 types – raw and dsp or processed, which were the same in our case. The static buffer example uses those features to run inference on a particular sample window. Because we are using raw features, we can directly convert this example into a live inference example by substituting the values copy-pasted into the feature array from the edge impulse UI with the values measured by the MLX sensor we are using. You can download all the required libraries from this link.
So, the following array-
This allows us to run our classification live on the Arduino Nano 33 IOT. The rest of the code requires a very deep understanding of Tf-lite and edge impulse APIs which is beyond the scope of this already extensive project.
Once you are done with the changes, select the Arduino 33 IoT in Board type and upload the code. After uploading the code open the serial monitor and the output looks as follows-
As you can see, the inference time is only around 3ms, which is great. Our model performs pretty well even on different days at different ambient temperatures. This is how you can use Edge Impulse Studio to train a custom machine learning model. Edge Impulse is a great platform for non-coders to develop machine learning models. If you have queries related to Edge Impulse or this project, you can post them in the comment section or use our Forum.
Technologies used
Hardware components
- Raspberry Pi
- USB Camera
- Pi Camera
- Jetson Nano
Software & tools
- Python
- TensorFlow
- OpenCV
- Jupyter Notebook
- Google Colab
Project demo video
What you get
- Working project / hardware kit, tested before delivery
- Complete source code with explanation
- Project demo and guidance for your viva
- Project report, PPT and IEEE paper support (on request)
Related AI projects

ESP32 CAM Object Detection using Edge Impulse TinyML
Deploy a custom TinyML object detection model trained on Edge Impulse on ESP32-CAM to identify objects like vegetables, gestures or products...
View project
ESP32 Real-Time Face Recognition Attendance System
Build a face recognition attendance system using ESP32-CAM that automatically logs attendance with timestamp to Firebase when a registered f...
View project
C++ Programming Language
C++ Programming Language — a beginner AI project built with HTML5, CSS3, JavaScript, complete with design details, implementation steps and...
View project
How to use ESP32 Camera Module for Video Streaming and Face Recognition
In this project, we are going to build a Face Recognition System using ESP32-CAM which will also work as an ESP32-CAM Security system by rec...
View project