Real-Time AC Current and Frequency Monitoring for Data Analysis and ML Training
In various industries and applications, it’s crucial to monitor the current and frequency of devices in real-time. These parameters are vital for the
- Suitable forB.Tech & M.Tech Embedded students
- Build time3-4 weeks
- LevelAdvanced
- Available atAjvika Labs, Kakinada
About this project
In various industries and applications, it’s crucial to monitor the current and frequency of devices in real-time. These parameters are vital for the longevity of frequency-sensitive appliances. Moreover, research-based or AI model training systems require real-time data logging for analysis and model training. Unfortunately, most ammeters and multimeters lack the capability to record data in real-time and save it for ML model training or research purposes. Even in other applications, data visualization, monitoring, and recording are essential.
Our solution addresses this problem by designing a web app that connects to an ammeter device. This app displays real-time ammeter data, generates real-time graphs, and provides an option to record and download data in CSV or TXT format for research or ML model training. The device uses the Web Serial API to connect via the USB port. However, our device is capable of wireless data display and recording using WiFi, which can be modified if desired.
The sensor used in this setup is the ACS712 current sensor, which can measure both AC and DC current . While it offers good accuracy, for precise measurements, you can replace the sensor and modify the code accordingly. The current circuit is suitable for most high-load appliances. The sensor comes in three variants: 5A, 20A, and 30A. In this case, we’ve used the 5A variant, but you can adjust the code based on the chosen sensor variant.
Circuit for AC Current and Frequency Measurement
The sensor uses 5V logic , while the IndusBoard Coin we are using operates on 3.3V logic , so we need to add a voltage divider circuit using two resistors. In the code, I have used and tested 10kΩ and 22kΩ resistors or 10kΩ and 2kΩ resistor ratios. In the testing code, you can change and modify the code as per your resistor ratio for the voltage divider circuit.
The divider circuit is configured as depicted in the circuit diagram provided. The sensor’s power can be supplied using a 5V external adapter or the 5V/Vin pin if USB is being used. The ground is connected to the sensor’s ground, and the midpoint of the voltage divider connects to any ADC-capable I/O pin on the board (the same pin must be configured in the code—here, pin 4 is used).
Code for Real-Time Current and Frequency Measurement
Two codes have been created: one for the Arduino, where sensor data is processed, frequency and current are calculated, and the results are sent to the serial port.
The other is a web app that connects to the serial port using the Web Serial API, displays the data, plots it in real-time, and performs real-time data logging.
The Arduino code for the IndusBoard Coin allows you to configure the resistor ratio, sensitivity, calibration, and ADC pin. It includes a calibration function that automatically calibrates the sensor at startup for the baseline signal from the sensor under no-load conditions.
Next, a function calculates the AC current in mA and A, based on sensor readings and sends it to the serial port. You can modify the code for other calibrations or manual calibration to enhance the sensor’s accuracy.
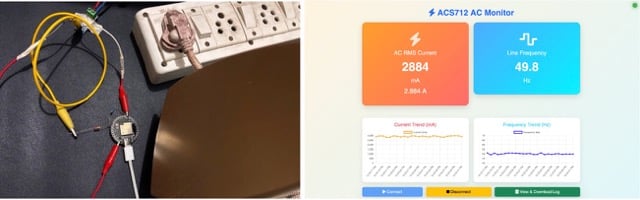
In the web app code, we create two cards: one to display the current data and another for the frequency. Below these cards, there are two graphs for plotting the data over time. At the bottom, we create a Connect/Disconnect button to connect the device and receive data using the Web Serial API. Additionally, there’s another button to display the database table and download the data as a CSV or TXT file on your laptop.
Recommended: Top 13 AI Engineering Projects .
Testing Real-Time Current and Frequency Measurement
Now, after uploading the code, save the web app code as an .html file format. Open that in the Chrome web browser. Now click on the “Connect” button, and it will now display the data. Now plug or tune in the load, you can see the change in the ampere reading and frequency of your power line. Now, click on the database, and it will display the database table and give you the option to download it as a CSV or TXT file.
SHARE YOUR THOUGHTS & COMMENTS Register or Login to leave a comment.
Smart Speed Monitoring System For Road Safety
Real-Time Face Tracking Using Raspberry Pi 4 Versus Raspberry Pi 5 With Hailo-8L
High-Voltage Capacitor Discharger
Alexa-Enabled Smart IoT Electricity Meter Switch Board
Smart Speed Monitoring System For Road Safety
Real-Time Face Tracking Using Raspberry Pi 4 Versus Raspberry Pi 5 With Hailo-8L
High-Voltage Capacitor Discharger
Real-time Web-based Home Automation
World’s Smallest Open-Source LoRa + GPS Module for Wearables and IoT (Only 3cm!)
Smallest Spy Video Streaming Camera
Wirelessly Control Multiple AC Appliances with Web Interface
Racetrack Shaped Resonators Enhances Light Trapping
AI Chip Uses Light Instead Of Electricity
AI Mini PC Targets Edge Computing Workloads
Battery-Free In-Tire Sensors For Autonomous Vehicles
Ultra-Low-Loss Isolated Current Sensor
STMicroelectronics has Introduced First Automotive Microcontroller With built-in AI Acceleration
Samsung Launched 200MP Image Sensor Called ISOCELL HP5
Aeva Introduced 4D LiDAR Sensor for Physical AI Systems
DIY: Audio Signal–Controlled LED Display Using LM3914
State Reduction In Sequential Circuits
Make Your Own Musical Temperature Alarm
Buck Converter vs Linear Voltage Regulator
Ultra-Compact RGB LED For Space-Constrained Designs
Compact Varistors For High Surge Protection
Gold Plated Reed Relays For High Voltage Systems
28nm Automotive MCU For Zonal E/E Architectures
JOB: RFIC Analog Engineer – Clock & Timing At Texas Instruments In Bengaluru
JOB: Electronics Specialist At ABB In Bengaluru
DSP / Audio Firmware Engineer (Intern) At Chordy.ai In Bengaluru
JOB: System Engineer At General Electric In Chennai
Circuit Design Calculators for Engineers and Students
Broadside Coupled Stripline Impedance Calculator
Edge Coupled Stripline Impedance Calculator
Asymmetric Stripline Impedance Calculator
Our solution addresses this problem by designing a web app that connects to an ammeter device. This app displays real-time ammeter data, generates real-time graphs, and provides an option to record and download data in CSV or TXT format for research or ML model training. The device uses the Web Serial API to connect via the USB port. However, our device is capable of wireless data display and recording using WiFi, which can be modified if desired.
The sensor used in this setup is the ACS712 current sensor, which can measure both AC and DC current . While it offers good accuracy, for precise measurements, you can replace the sensor and modify the code accordingly. The current circuit is suitable for most high-load appliances. The sensor comes in three variants: 5A, 20A, and 30A. In this case, we’ve used the 5A variant, but you can adjust the code based on the chosen sensor variant.
Circuit for AC Current and Frequency Measurement
The sensor uses 5V logic , while the IndusBoard Coin we are using operates on 3.3V logic , so we need to add a voltage divider circuit using two resistors. In the code, I have used and tested 10kΩ and 22kΩ resistors or 10kΩ and 2kΩ resistor ratios. In the testing code, you can change and modify the code as per your resistor ratio for the voltage divider circuit.
The divider circuit is configured as depicted in the circuit diagram provided. The sensor’s power can be supplied using a 5V external adapter or the 5V/Vin pin if USB is being used. The ground is connected to the sensor’s ground, and the midpoint of the voltage divider connects to any ADC-capable I/O pin on the board (the same pin must be configured in the code—here, pin 4 is used).
Code for Real-Time Current and Frequency Measurement
Two codes have been created: one for the Arduino, where sensor data is processed, frequency and current are calculated, and the results are sent to the serial port.
The other is a web app that connects to the serial port using the Web Serial API, displays the data, plots it in real-time, and performs real-time data logging.
The Arduino code for the IndusBoard Coin allows you to configure the resistor ratio, sensitivity, calibration, and ADC pin. It includes a calibration function that automatically calibrates the sensor at startup for the baseline signal from the sensor under no-load conditions.
Next, a function calculates the AC current in mA and A, based on sensor readings and sends it to the serial port. You can modify the code for other calibrations or manual calibration to enhance the sensor’s accuracy.
In the web app code, we create two cards: one to display the current data and another for the frequency. Below these cards, there are two graphs for plotting the data over time. At the bottom, we create a Connect/Disconnect button to connect the device and receive data using the Web Serial API. Additionally, there’s another button to display the database table and download the data as a CSV or TXT file on your laptop.
Recommended: Top 13 AI Engineering Projects .
Testing Real-Time Current and Frequency Measurement
Now, after uploading the code, save the web app code as an .html file format. Open that in the Chrome web browser. Now click on the “Connect” button, and it will now display the data. Now plug or tune in the load, you can see the change in the ampere reading and frequency of your power line. Now, click on the database, and it will display the database table and give you the option to download it as a CSV or TXT file.
SHARE YOUR THOUGHTS & COMMENTS Register or Login to leave a comment.
Smart Speed Monitoring System For Road Safety
Real-Time Face Tracking Using Raspberry Pi 4 Versus Raspberry Pi 5 With Hailo-8L
High-Voltage Capacitor Discharger
Alexa-Enabled Smart IoT Electricity Meter Switch Board
Smart Speed Monitoring System For Road Safety
Real-Time Face Tracking Using Raspberry Pi 4 Versus Raspberry Pi 5 With Hailo-8L
High-Voltage Capacitor Discharger
Real-time Web-based Home Automation
World’s Smallest Open-Source LoRa + GPS Module for Wearables and IoT (Only 3cm!)
Smallest Spy Video Streaming Camera
Wirelessly Control Multiple AC Appliances with Web Interface
Racetrack Shaped Resonators Enhances Light Trapping
AI Chip Uses Light Instead Of Electricity
AI Mini PC Targets Edge Computing Workloads
Battery-Free In-Tire Sensors For Autonomous Vehicles
Ultra-Low-Loss Isolated Current Sensor
STMicroelectronics has Introduced First Automotive Microcontroller With built-in AI Acceleration
Samsung Launched 200MP Image Sensor Called ISOCELL HP5
Aeva Introduced 4D LiDAR Sensor for Physical AI Systems
DIY: Audio Signal–Controlled LED Display Using LM3914
State Reduction In Sequential Circuits
Make Your Own Musical Temperature Alarm
Buck Converter vs Linear Voltage Regulator
Ultra-Compact RGB LED For Space-Constrained Designs
Compact Varistors For High Surge Protection
Gold Plated Reed Relays For High Voltage Systems
28nm Automotive MCU For Zonal E/E Architectures
JOB: RFIC Analog Engineer – Clock & Timing At Texas Instruments In Bengaluru
JOB: Electronics Specialist At ABB In Bengaluru
DSP / Audio Firmware Engineer (Intern) At Chordy.ai In Bengaluru
JOB: System Engineer At General Electric In Chennai
Circuit Design Calculators for Engineers and Students
Broadside Coupled Stripline Impedance Calculator
Edge Coupled Stripline Impedance Calculator
Asymmetric Stripline Impedance Calculator
Technologies used
Hardware components
- Arduino
- Raspberry Pi
- Relay
- MPU
- LED
- Button
- Switch
- Sensor
- Module
- Board
- Resistor
- Capacitor
- Battery
- Camera
- GPS
What you get
- Working project / hardware kit, tested before delivery
- Complete source code with explanation
- Project demo and guidance for your viva
- Project report, PPT and IEEE paper support (on request)
Delivery & Payment
Delivery takes a minimum of two weeks from the date your inquiry is confirmed.
Payment is in two parts:
• 50% advance to start the project
• Remaining 50% before delivery
Note:
• Documentation and PPT are not included by default
• If you need documentation/PPT, it can be arranged for extra time and cost
We'll confirm the exact timeline and cost with you after reviewing your requirements.
Related Embedded projects

Embedded
ESP32 Fingerprint Attendance System with Live Web Dashboard
Build a biometric attendance system using ESP32 with AS608 fingerprint sensor that logs attendance with timestamp to web dashboard and Googl...
View project
Embedded
Mars Rover Robot Replica using ESP32 CAM and Arduino
Build a Mars Rover robot replica using ESP32-CAM and Arduino with a rocker-bogie suspension system, live video streaming, and smartphone app...
View project
Embedded
ESP32 CAN Bus Tutorial Interfacing MCP2515 with ESP32
Learn CAN bus communication with ESP32 and MCP2515 CAN controller to send and receive data in automotive and industrial applications.
View project
Embedded
ESP32 MP3 Music Player with SD Card and I2S Amplifier
Build a standalone ESP32 MP3 music player that reads audio from SD card and outputs high-quality audio via I2S DAC amplifier with web contro...
View project